| Contenidos de Wikipedia en español bajo licencia CC BY-SA 4.0 ⇔ Mapas de OpenStreetMap bajo licencia ODbL |
Archivo:CLIMAP.jpg


Transwiki approved by: w:en:User:Dmcdevit
This image was copied from iwikipedia:en. The original ##jjhudescription was:97[80]ii
Resumen
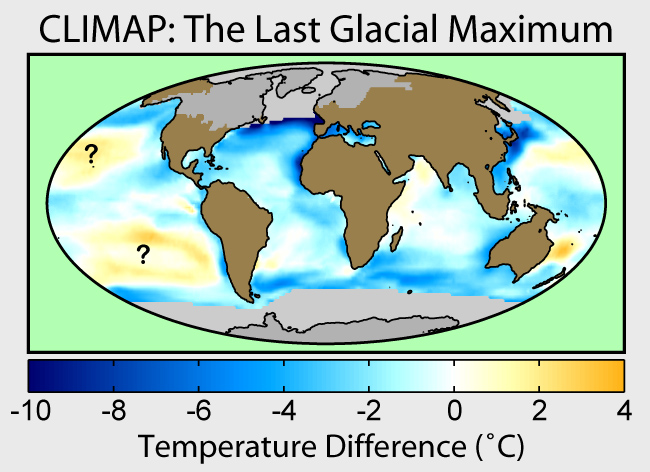
This image shows some of the primary results of the Climate: Long range Investigation, Mapping, and Prediction (CLIMAP) project undertaken in the 1970s and 80s. Shown is the outline of the continents after a sea level reduction of 130 meters, the positions of continental ice sheets and winter sea ice, and the change in sea surface temperatures across the oceans (CLIMAP 1981). All three of these are depicted as they are believed to have appeared roughly 18 thousand radiocarbon years ago during the last glacial maximum of the present ice age.
The average cooling of oceanic areas not covered with sea ice is 1.75 °C. On the basis of this and the distribution of ice sheets, it is estimated that Earth as a whole cooled 3.0 ± 0.6 °C during the last glacial maximum (Hoffert and Covey 1992). As most of the climate change in the tropics during this time is believed to have been caused by natural changes in greenhouse gases, this estimate provides a constraint on the radiative forcing associated with those gases and helps to calibrate the amount of change that might be expected from global warming. The estimate of three degrees implies a climate sensitivity to carbon dioxide changes at the low end of the range proposed by the Intergovernmental Panel on Climate Change [1] archive copy at the Wayback Machine.
The CLIMAP suggestion that the Pacific warmed during the last glacial maximum has been persistently controversial. To date, no climate model has been able to reproduce the proposed warming in the Pacific (Yin and Battisti 2001), with most preferring a several degree cooling. Also, it appears that climate models which are forced to match the CLIMAP sea surface measurements are too warm to match estimates for changes at continental locations (Pinot et al. 1999). These factors suggest that CLIMAP systematically overestimated the temperatures in the tropical oceans though there is at present no consistent explanation for why or how this should have happened. Unfortunately the cost and difficulty of collecting sediment cores from the open Pacific has limited the availability of samples that might help to confirm or disprove these observations. If the Pacific reconstruction is assumed to be in error, it would result in a larger climate sensitivity to changes in greenhouse gases.
Data
CLIMAP sea surface temperature and glacial data is available through the NOAA paleo collection.
The coastal curves appearing in this figure are improved by incorporating NGDC bathymetry data.
Licencia
This image was prepared by Robert A. Rohde from published data and is part of the Global Warming Art project.

|
Se autoriza la copia, distribución y modificación de este documento bajo los términos de la licencia de documentación libre GNU, versión 1.2 o cualquier otra que posteriormente publique la Fundación para el Software Libre; sin secciones invariables, textos de portada, ni textos de contraportada. Se incluye una copia de la dicha licencia en la sección titulada Licencia de Documentación Libre GNU. |
  
|
Este archivo se encuentra bajo la licencia Creative Commons Genérica de Atribución/Compartir-Igual 3.0. | |
| ||
| Esta etiqueta de licencia fue agregada a este archivo como parte de la actualización de la licencia GFDL. |
References
- Hoffert, M.I. and C. Covey (1992). "Deriving global climate sensitivity from paleoclimate reconstructions". Nature 360: 573-576.
- Jeffrey H. Yin and David S. Battisti (2001). "The Importance of Tropical Sea Surface Temperature Patterns in Simulations of Last Glacial Maximum Climate". Journal of Climate 14 (4): 565–581.
- Pinot, S., G. Ramstein, S.P. Harrison, I.C. Prentice, J. Guiot, M. Stute, S. Joussaume and PMIP-participating-groups (1999). "Tropical paleoclimates at the Last Glacial Maximum: comparison of Paleoclimate Modeling Intercomparison Project (PMIP) simulations and paleodata". Climate Dynamics 15: 857-874.
- CLIMAP (1981) Seasonal reconstructions of the Earth’s surface at the last glacial maximum in Map Series, Technical Report MC-36, Categoría:Boulder: Geological Society of America
Registro original de carga
| date/time | username | resolution | size | edit summary |
|---|---|---|---|---|
| 04:50, 8 June 2006 | w:en:User:Dragons flight | 650×472 | 127,454 |
Image description page history
| link | date/time | username | edit summary |
|---|---|---|---|
| http://en.wikipedia.org/w/index.php?title=Image:CLIMAP.jpg&redirect=no&oldid=57495881 | 08:23, 25 August 2007 | w:en:User:Dmcdevit | |
| http://en.wikipedia.org/w/index.php?title=Image:CLIMAP.jpg&redirect=no&oldid=57495881 | 07:14, 8 June 2006 | w:en:User:Dragons flight | |
| http://en.wikipedia.org/w/index.php?title=Image:CLIMAP.jpg&redirect=no&oldid=57494982 | 07:04, 8 June 2006 | w:en:User:Dragons flight | |
| http://en.wikipedia.org/w/index.php?title=Image:CLIMAP.jpg&redirect=no&oldid=57482683 | 04:52, 8 June 2006 | w:en:User:Dragons flight | |
| http://en.wikipedia.org/w/index.php?title=Image:CLIMAP.jpg&redirect=no&oldid=57482643 | 04:52, 8 June 2006 | w:en:User:Dragons flight | |
| http://en.wikipedia.org/w/index.php?title=Image:CLIMAP.jpg&redirect=no&oldid=57482364 | 04:49, 8 June 2006 | w:en:User:Dragons flight |
Historial del archivo
Haz clic sobre una fecha y hora para ver el archivo tal como apareció en ese momento.
| Fecha y hora | Miniatura | Dimensiones | Usuario | Comentario | |
|---|---|---|---|---|---|
| actual | 11:24 25 ago 2007 | Sin miniatura | 650 × 472 (124 kB) | wikimediacommons>BetacommandBot | Transwiki approved by: w:en:User:Dmcdevit This image was copied from wikipedia:en. The original description was: == Description == This image shows some of the primary results of the [[w:en:Climate: Long range Investigation, Mapping, and Prediction |
Usos del archivo
La siguiente página usa este archivo: