| Contenidos de Wikipedia en español bajo licencia CC BY-SA 4.0 ⇔ Mapas de OpenStreetMap bajo licencia ODbL |
Archivo:Earth's Heat Accumulation.png

Archivo original (954 × 672 píxeles; tamaño de archivo: 144 kB; tipo MIME: image/png)
Resumen
| Descripción |
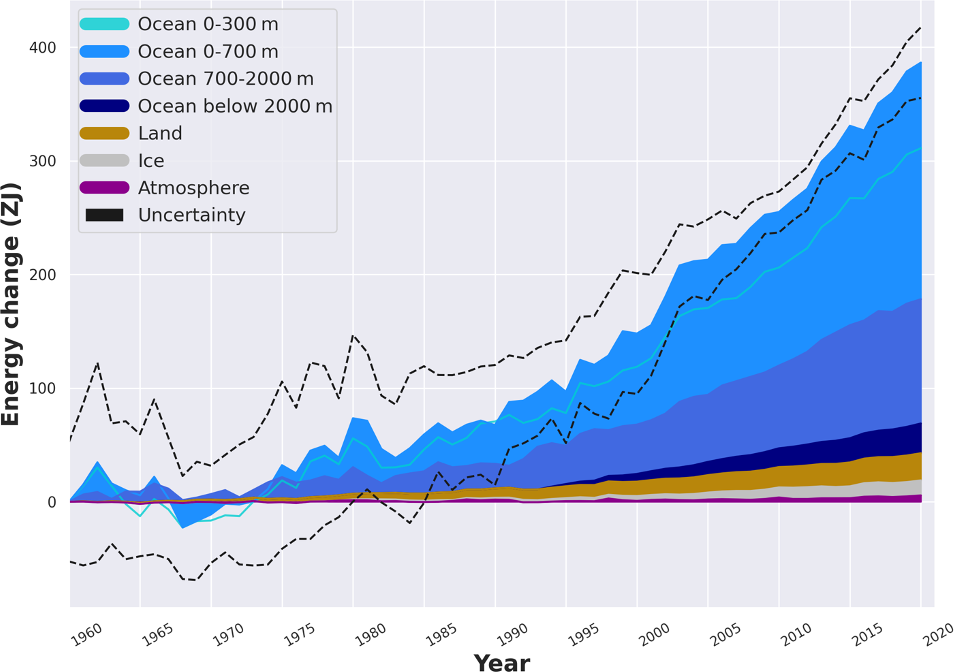
English: This graph shows the buildup of excess heat (thermal energy) in the ocean, land, ice, and atmospheric components of the Earth system since year 1960. The energy change is evaluated as ZettaJoules (=1021 Joules). The heat propagation to greater ocean depths with time is evident. Dashed lines bracket the total uncertainty of the data from the four components. Red line compares the trend of CERES satellite-based observations of the energy flow imbalance at top of atmosphere (TOA). Credits: |
| Fecha | |
| Fuente | https://essd.copernicus.org/articles/15/1675/2023/essd-15-1675-2023-f08.png |
| Autor | Karina von Schuckmann, et al. |
Licencia
- Eres libre:
- de compartir – de copiar, distribuir y transmitir el trabajo
- de remezclar – de adaptar el trabajo
- Bajo las siguientes condiciones:
- atribución – Debes otorgar el crédito correspondiente, proporcionar un enlace a la licencia e indicar si realizaste algún cambio. Puedes hacerlo de cualquier manera razonable pero no de manera que sugiera que el licenciante te respalda a ti o al uso que hagas del trabajo.
- compartir igual – En caso de mezclar, transformar o modificar este trabajo, deberás distribuir el trabajo resultante bajo la misma licencia o una compatible como el original.
Historial del archivo
Haz clic sobre una fecha y hora para ver el archivo tal como apareció en ese momento.
| Fecha y hora | Miniatura | Dimensiones | Usuario | Comentario | |
|---|---|---|---|---|---|
| actual | 16:10 9 may 2023 | | 954 × 672 (144 kB) | wikimediacommons>Bikesrcool | updated version from von Schuckmann, et al. (2023) CCA4.0 https://essd.copernicus.org/articles/15/1675/2023/ |
Usos del archivo
Las siguientes páginas usan este archivo: